











KOREOS · Pantallas y funciones
Reports: how to use
How to set the period in the Reports Dashboard and open each area’s reports.
Este artículo aún no está traducido a su idioma: se muestra la versión en English.
En esta página
What it is
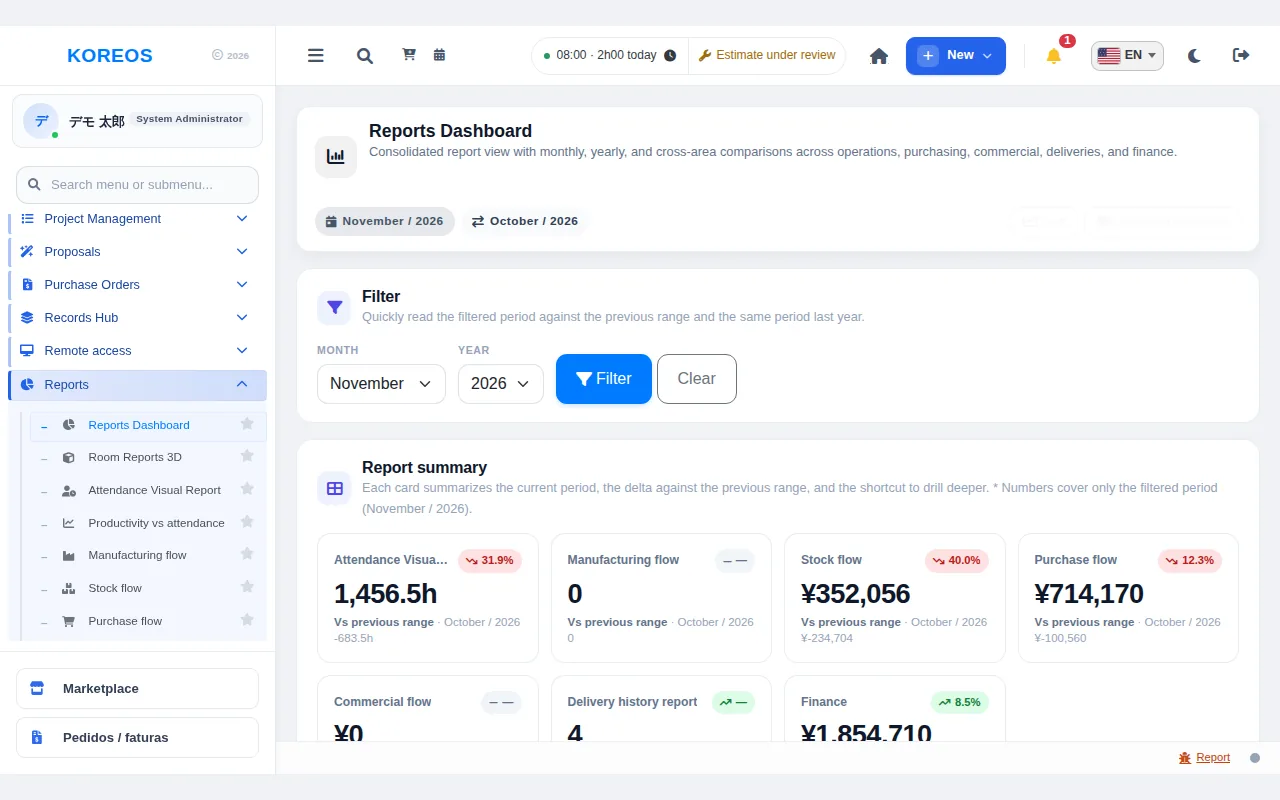
Reports is the analysis area for looking at the company month by month and year by year. From the "Reports Dashboard" you open the attendance, manufacturing, stock, purchasing, sales and finance reports and see the comparison with the previous period.
Who it is for
Executives, managers and department leads, in meetings and at the monthly close. Available to people with permission.
Step by step
- In the menu, open "Reports" and choose "Reports Dashboard".
- Under "Filter", pick the "Month" and "Year" and click "Filter" to set the period. "Clear" returns to the default.
- In the "Report summary" cards, see attendance hours, purchasing, stock, finance and other figures, with the change against the previous period.
- From the card of the subject you want to explore, open the specific report (Attendance Visual Report, Manufacturing flow, Stock flow, Purchase flow, Commercial flow, etc.).
- For board meetings, use the "Executive Dashboard" for the overall picture and then go into each area’s reports.
- In reports that have print or export buttons, use them to keep the result.
Tips
- At the monthly close, filter the period and compare with the previous month to spot changes.
- In attendance reports you can filter by person and period.
- There are reports for costs by department and delivery history, among others.
- What you see depends on your permissions.
Common questions
What is the period compared with?
With the previous period and with the same period last year.
Can I keep a copy of a report?
Some have print or export buttons; check on the screen itself.
I do not see "Reports" in my menu.
It can depend on permission or plan. Ask your administrator.
Availability and plan: see the Marketplace article.